Photo Data Visualizations
Table of Contents
I spent a little time this evening playing around with matplotlib, seaborn and my photo collection.
Some early results PDF.:
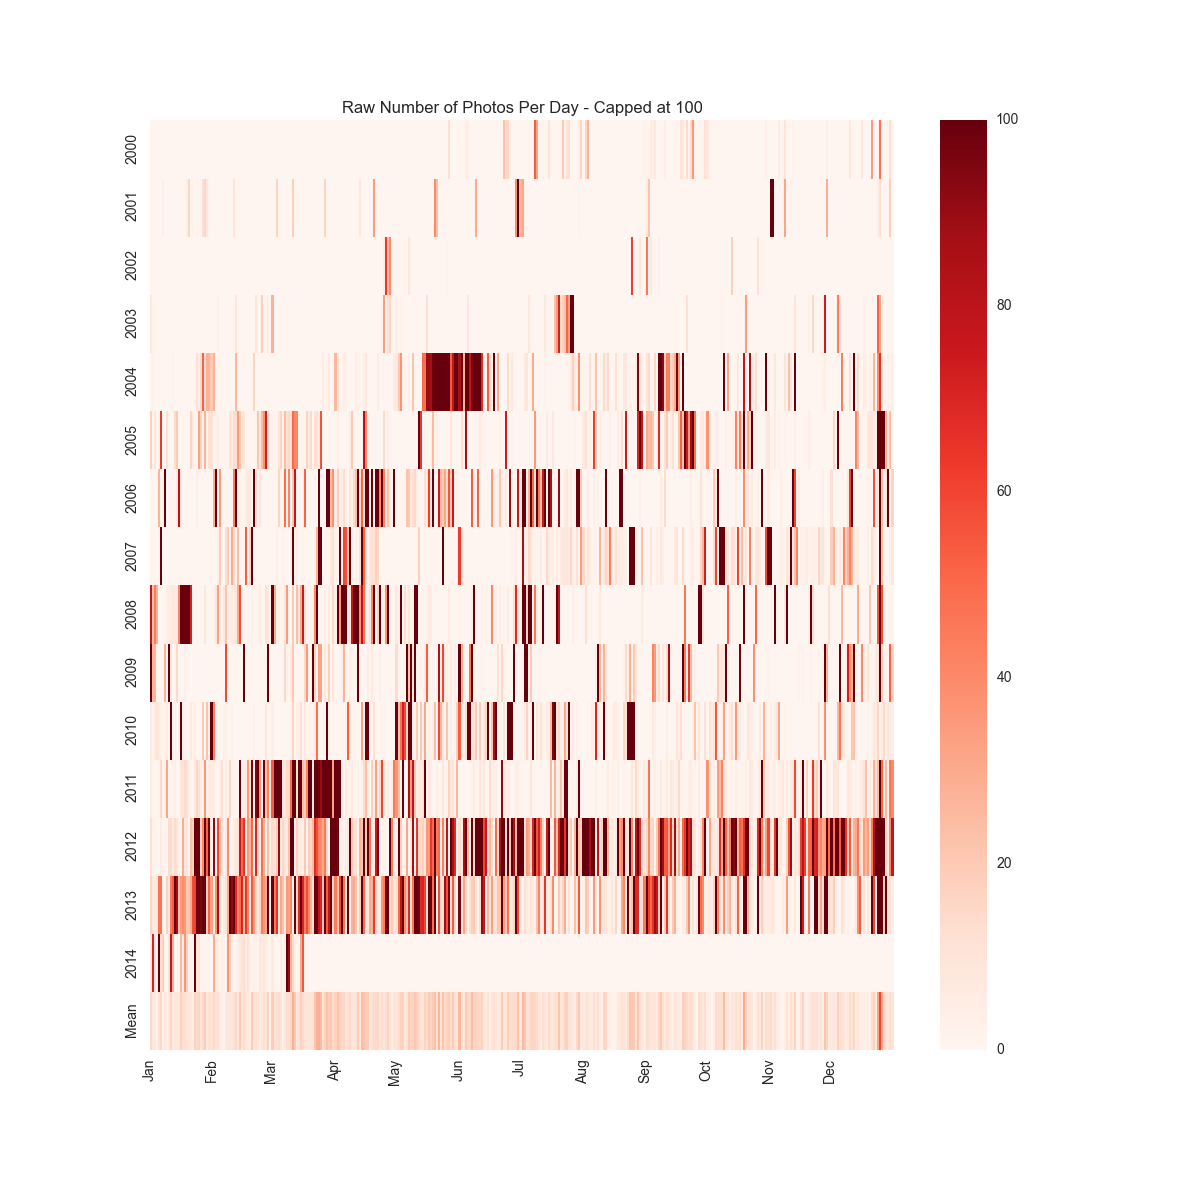
Heatmap of Photos over Time (First Cut):
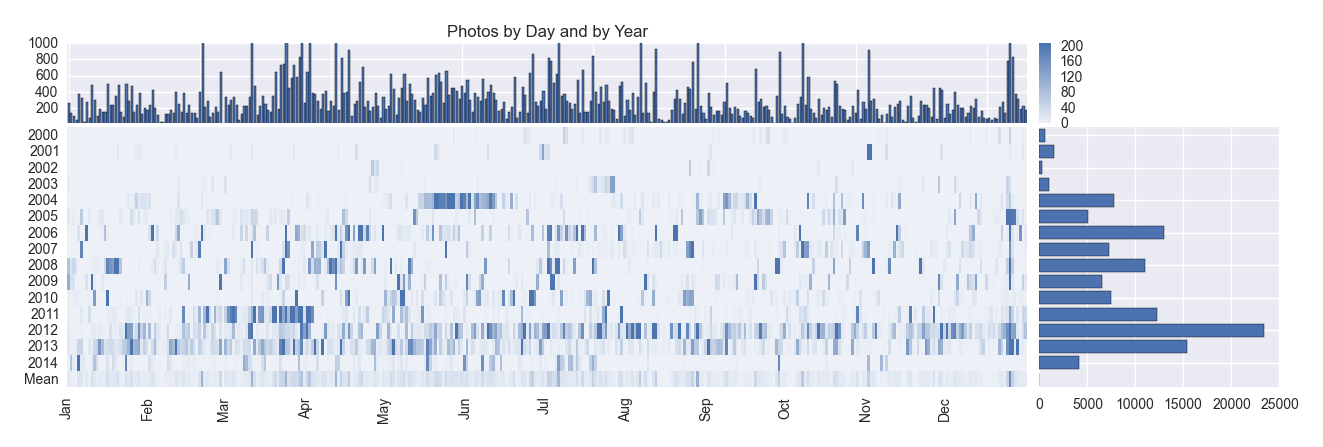
With a little more work, we add a histogram by year and by day-of-year PDF:
High resolution PDF_ for viewing.
When I get a chance, I’ll likely write this up a little more. (or not).
comments powered by Disqus